When you create a top 5 sorted report with a PivotTable, the Pivot Chart isn’t always what you expect, there is an easy solution.
You can download the example file using the button at the bottom of the post.
The image below has the data layout.
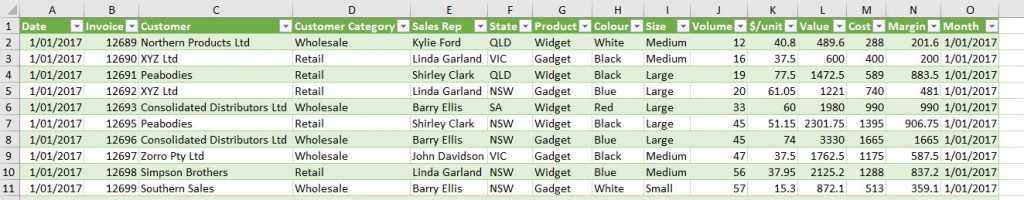
When you create the filter the top 5 PivotTable report and then sort it Largest to Smallest, it looks like this.

Then when you add the PivotChart it looks like this.

Not quite what we were expecting – its showing smallest to largest.
We need to switch the order of the vertical axis. Luckily there is a setting you can change to get the chart displaying correctly – largest to smallest.
Click the left axis and press Ctrl + 1 ( use the 1 on the keyboard).
In the task pane that opens on the right select Categories in reverse order.

Problem solved.

Please note: I reserve the right to delete comments that are offensive or off-topic.