The term grouping in Excel has many different meanings, probably more than any other term in Excel.
You can group sheets, you can group rows and columns, you can group data in a pivot table and you can group graphic objects together.
When grouping you can often use the Ctrl or Shift keys to make multiple selections.
Grouping Sheets
Grouping sheets allows to edit and change a number of sheets in one step. Grouping sheets comes with danger though, because it is not very apparent that the sheets are grouped and it is easy to forget, which can mean you could be making changes to other sheets when you think you are just changing the current sheet.
When grouping sheets Excel places [Group] on the right of the file’s name at the top of the screen. The sheet colours are also changed slightly when grouped. Neither of these changes is very obvious. The danger is that a file could be saved with the sheets still grouped. Then when the file is opened the sheets remain grouped, leaving the possibility that the user doesn’t realise that other sheets are selected and making changes to them. If you do use sheet grouping, make sure you ungroup the sheets after you have finished. Ungrouping sheets is as easy as clicking another sheet or right-clicking a sheet tab and choosing Ungroup Sheets.
When you have grouped sheets some options are disabled.
Grouping Rows and Columns
Grouping rows and columns enables you to hide and unhide those rows and columns easily and quickly. The advantage with using grouping to do the hiding is that icons are added to the sheet to make it obvious that rows or columns are hidden. Those icons also make it easy to hide and unhide the rows and columns. See a previous blog post on grouping rows and columns here. You can create a hierarchy within the grouping to show more and more detail.
Grouping in Pivot Tables
Grouping in pivot tables allows you to summarise categories and to create monthly or weekly reports from daily data. You can group within the pivot table reports by rows or columns.
Grouping Graphics
Grouping graphics allows to modify, resize and move those graphics in one step. Charts are treated as graphics and you can use grouping to re-size all charts to the same size and to align then.
When grouping graphics the Select Objects icon can make the selection process easier. Simply use the mouse to draw an area around the graphics you want to select The icon is in the Find & Replace drop down icon on the far right of the Home ribbon – see image below.
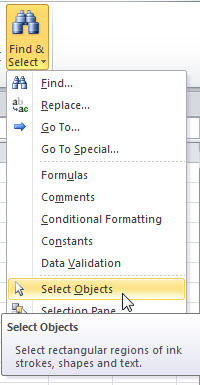
After you use the icon you press the Esc key to return to the normal mouse cursor. You can right click the icon to add it to the Quick Access Toolbar.
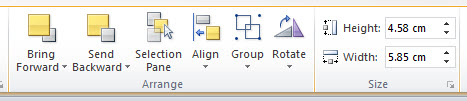
The Format ribbon tab allows to modify the graphics. The right side of the ribbon tab has the most commonly used options.
Please note: I reserve the right to delete comments that are offensive or off-topic.