A Sparkline chart is a single data series chart (graph) that exists in a cell. Usually, you only need to select one range to create a Sparkline. Sometimes you may need to handle missing dates.
If the date range you are plotting is incomplete and you want to show the gaps in the dates then you may need to select two ranges to create the Sparkline.
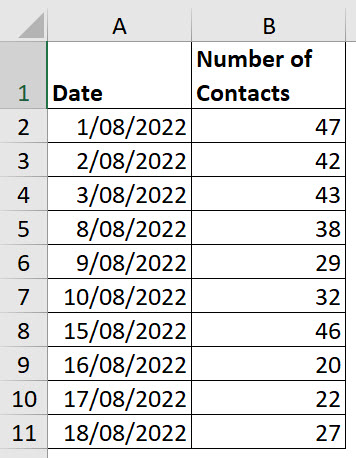
Check out the image below. It has a series of daily contacts made, but there are dates missing.
If we create the Sparkline in a merged cell in D2 then it looks like this.

We need this to show the gaps in the dates. To do that select cell D2 and then click the Sparkline ribbon tab. Click the Axis drop-down and choose Date Axis Type.

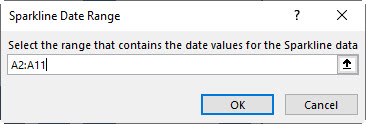
In the dialog that opens select the range with the dates, in our case A2:A11 and click OK.
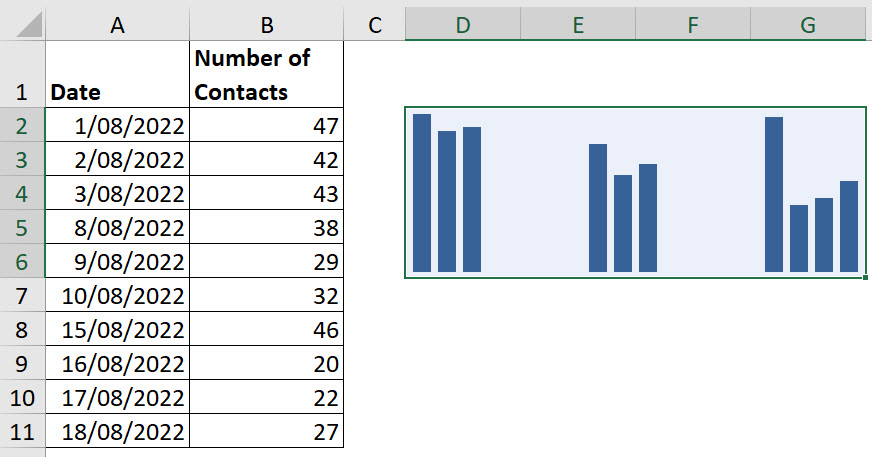
The chart updates as per the image below.

Let’s fix the vertical Axis, it doesn’t start at zero. Unfortunately the default setting starts at a number just under the minimum number in the data set. Column charts should start at zero.
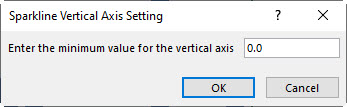
With cell D2 selected click the Sparkline ribbon tab and click the Axis drop-down and choose Custom Value in the Vertical Axis Minimum Values Options section.

In the dialog that opens zero will display, click OK to update.
The final chart is shown below.
Please note: I reserve the right to delete comments that are offensive or off-topic.