Switching between rows and columns in a normal chart is easy via a button on the Design tab. But how do you do it with a PivotChart?
By switching between rows and column in a normal Excel chart you can discover a different, and sometimes a better way, to display the data.

The button on the Design ribbon tab works for normal charts but is not available for PivotCharts.
PivotCharts don’t have a Design tab. So how do you do it?
Right click the PivotChart and choose Select Data.
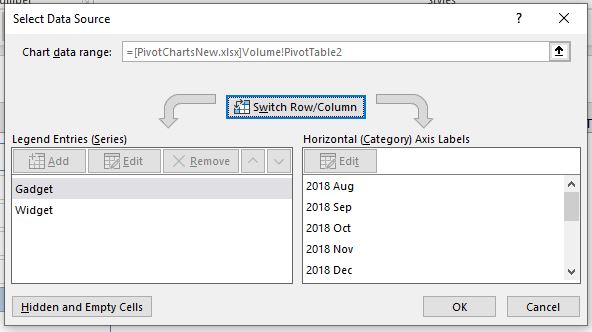
The Switch Row/Column button is hiding in there. Click OK once you have clicked it.
Note that the chart doesn’t start plotting with series in rows. The pivot table itself pivots its rows and columns, and the chart still plots the pivot layout by columns.