When you are building a PivotTable based on two related tables you may see unusual layouts that don’t make sense. Don’t worry, when you add values to the table all will be fixed.
Relationships were added in Excel 2013. Below are two articles (with videos) covering Relationships.
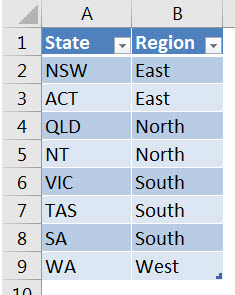
In this example I have two related tables. A Sales table with a Sales_State field and a State table that allocates each state to a region. The state table is shown below.
When you start to build a PivotTable based on related tables you can get some unusual layouts.
If I drag the Region (from the State table) underneath the Sales_State field (from the Sales tables) it looks wrong – see below.
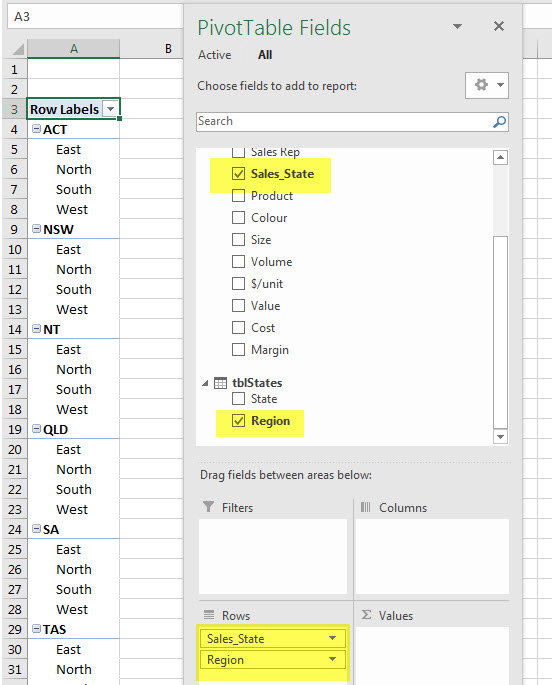
Obviously each state has been allocated to a single region. Why does it list every region under each state?
I am not really sure. I think it is just covering all the combinations until you add a value to do some calculations, and then all is fixed – see below.
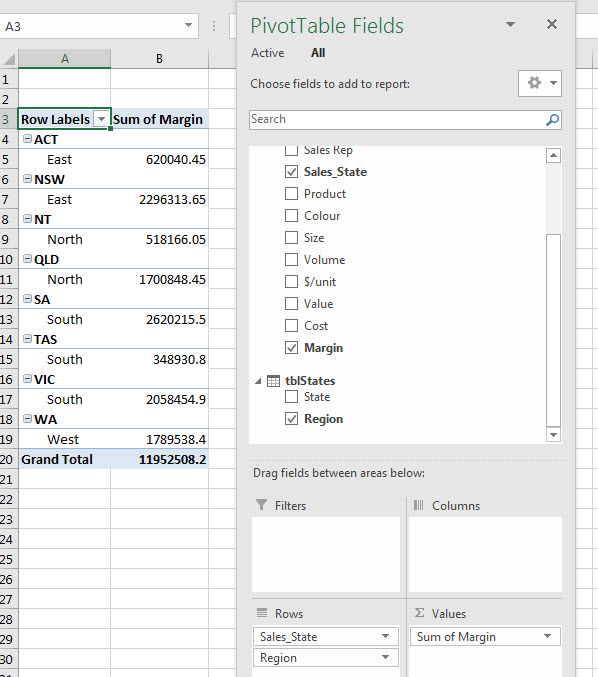
Don’t panic when building the report if it looks wrong. Add the values and all will be revealed and fixed.
Please note: I reserve the right to delete comments that are offensive or off-topic.