When plotting Actuals and Forecasts on a single line chart you may want to use a vertical dotted line to identify where the Actuals finish and the Forecasts begin.
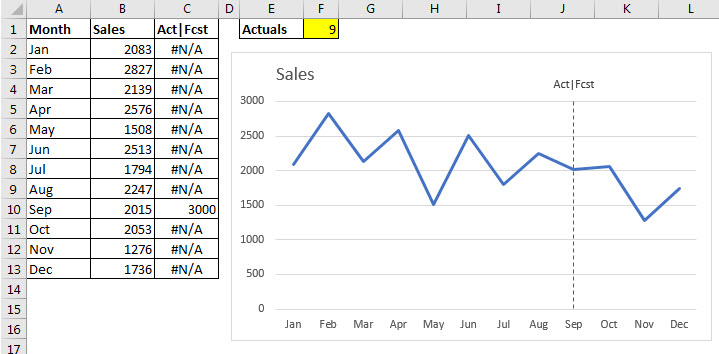
Examine the structure below.
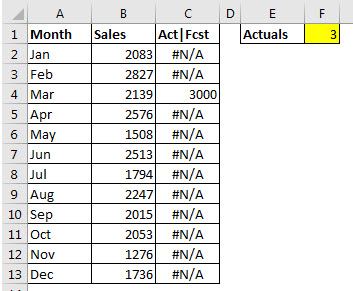
Column C contains a formula which is driven by the input cell F1.
The formula in cell C2 is
=IF(COUNT($B$2:B2)=$F$1,ROUNDUP(MAX($B$2:$B$13),-3),NA())
This formula has been copied down.
Using the NA function to display the #N/A error stops Excel from plotting any other values in column C.
This formula causes column C to have a single amount representing an amount equal to, or higher, than the highest value in Column B.
This single amount will be used to provide a vertical dotted line.
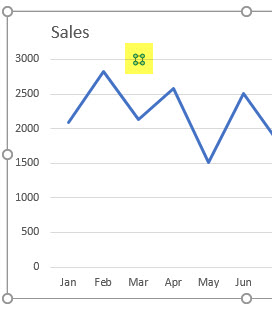
Select the range A1:C13. Create a standard Line Chart and delete the legend.
Change the Vertical Axis maximum value to match the value from column C.

Select the single point from column C on the charts – this may be fiddly. See below
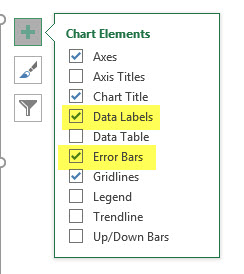
With that point selected click the plus sign – right, top corner of chart – and select Data Labels and Error Bars. See below.
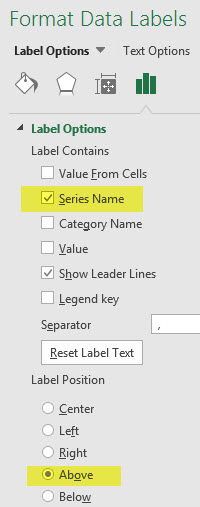
Select the Data Label on the chart and have it display the Series Name and then select the Above Label position – see below.
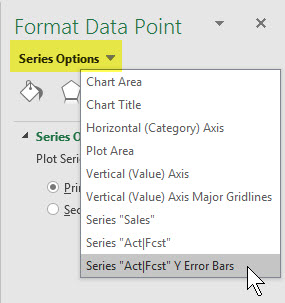
With the Data Point selected, use the drop down on the Task Pane Series Options to select the Error Bars – see below.
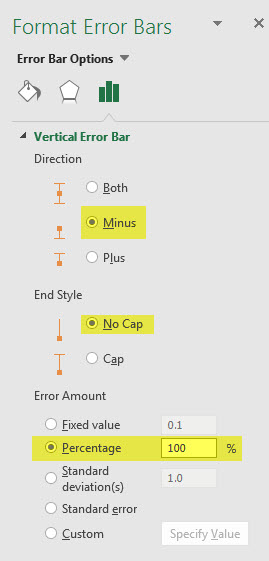
Change the options as shown below – Direction = Minus, End Style = No Cap and Percentage = 100%. This creates a vertical line below the point selected.
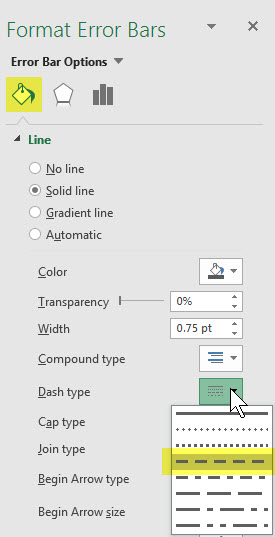
We then need to make the line dotted – select the Paint Can icon and make the changes shown below.
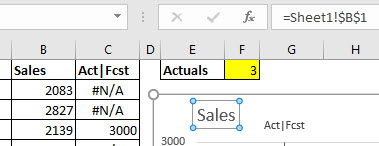
Link the Chart Title to cell B1 by clicking the title and then clicking inside the Formula Bar and pressing = and clicking cell B1 with the mouse – see below.
That’s it, the chart is ready to run.
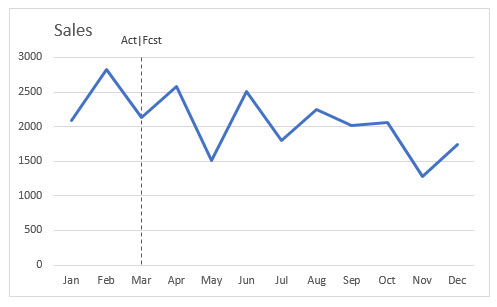
Changing cell F1 updates the chart.
Spectacular piece of knowledge… a truly piece of art.
Thank you very much for share your skills.
Cheers!!!!
?