Recently a client wanted help in summarising a large data list of employees. They wanted to identify the years of service in terms of 5, 10, 15 years and other milestone years based on a start date.
The list they had looked like the one below (made up names and start dates).

(The file with this example and solution can be downloaded via the button at the bottom of the post.)
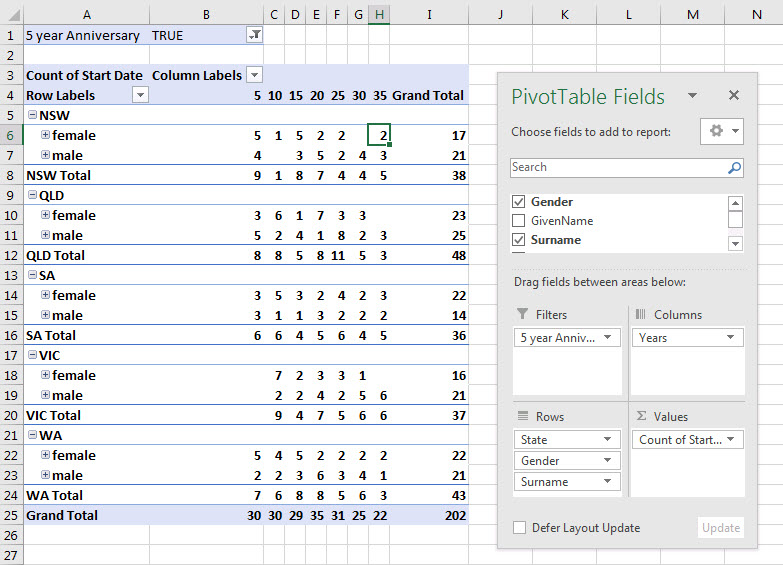
By adding a couple of columns to this list we can then use a Pivot table to summarise the list into State, Years and Gender.
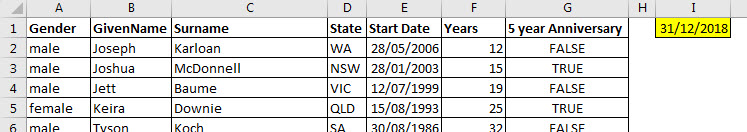
We have added the end of the current year in a yellow input cell – cell I1.
The formula in cell F2 in the Years column is
=YEAR($I$1)-YEAR(E2)
This takes the year from the input cell and deducts the year of the relevant start date. We are not concerned about fractions of years, we just want to identify the total number of completed years.
Having figured out how many years, we then need to identify the milestone years. Any number divisible by 5 is a milestone year. Excel has a little-known function that can make this calculation easy. The MOD function is unusual in that is does a division calculation and it returns the remainder when you divide one number by another. For example the MOD function below returns 2
=MOD(17,5)
17 is divided by 5. 5 goes into 17 three times with a remainder of 2. The MOD function returns the 2. This makes it easy to know if one number divides exactly into another number. If it does the MOD returns zero. In our case we need to know all the numbers that 5 divides exactly into. The formula for cell G2 is
=IF(F2=0, FALSE,MOD(F2,5)=0)
This will display TRUE for milestone years and FALSE for all others.
If a year number is zero the MOD function will return a zero. We are not interested in a zero year so we have to check for a zero year first using the IF function. Then we use the MOD function to identify milestone years.
MOD(F2,5)=0
This returns TRUE when the year is exactly divisible by 5 and FALSE in all other cases.
With these new columns added we can create a PivotTable report to summarise the data as per the image below. This counts how many entries for each category.
Please note: I reserve the right to delete comments that are offensive or off-topic.