Excel has two options that relate to top and bottom scores. These are usually shown as Top 10 or Bottom 10 options. In both cases they are much more flexible than that.
Conditional Formats
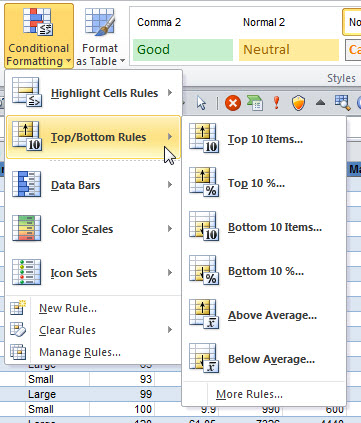
You can automatically highlight the top or bottom items in a list. The option says Top 10, but you can choose between top or bottom, and between numbers of items, or a percentage. This can go hand-in-hand with Pareto analysis (aka 80/20 rule).
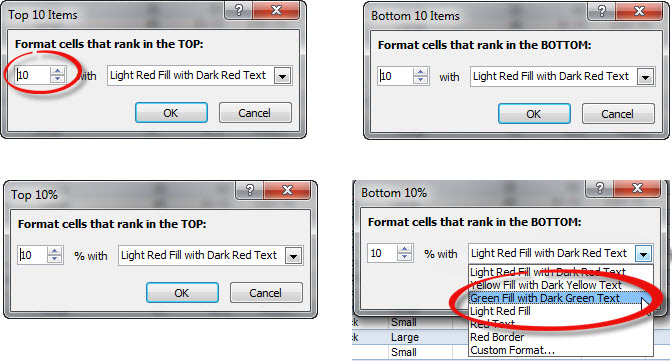
See the conditional formatting options below. You can select how many items or the percentage and what format to apply.
Filtering
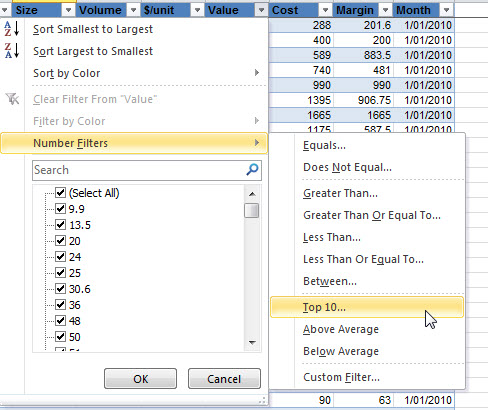
In value fields there is an option to display the top 10 values. This too, has the choice between displaying top or bottom, and numbers or a percentage. This option also applies to filtering done in a Pivot Table.
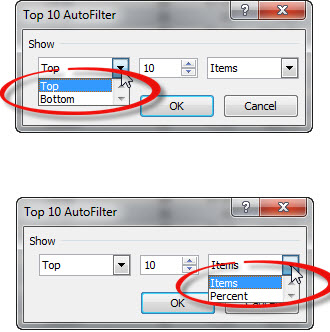
See Filtering options below. There are two drop downs where you can select top or bottom and Items or Percentage. The number in the middle can also be modified.
Please note: I reserve the right to delete comments that are offensive or off-topic.