Are you trying to get your head around Filter context in DAX? I watched a video from the sqlbi.com guys and it explained it well. I thought I could add an Excel flavour to it.
I won’t be showing any DAX, but I wanted to use Excel to show what was happening in DAX as far as the filter context is concerned.
What is DAX?
DAX is the formula language of PowerPivot and Power BI. It is an extremely powerful formula language that performs calculations on relational data bases. DAX functions are similar to Excel’s functions but they are much more powerful and versatile.
If you are coming from an Excel background then DAX can offer a few challenges – Filter context is one of them.
DAX Filter Context
DAX formulas in PowerPivot and Power BI can have a filter context. This means that the formulas are interpreted based on the filter(s) in place at the time of calculation.
Filters can be applied from lots of different sources. Also there may not be any filters in place.
In Excel we are used to SUMIF and SUMIFS where we can conditionally sum a table range to return a result based on certain criteria.
DAX IS NOT LIKE THAT!
DAX applies filters to the table and then returns a result based on the filtered rows only.
In Excel that is the same as the SUBTOTAL function, which can perform calculations on a filtered table and only add up the visible (filtered) rows.
Most times when using the SUBTOTAL function you use 9 at the start of the function – this instructs Excel to SUM the range.
On a filtered list using 9 will only add up the visible/filtered cells.
To add up only visible cells ignoring all hidden cells, no matter how they were hidden, you can use 109 in the SUBTOTAL function.
Example
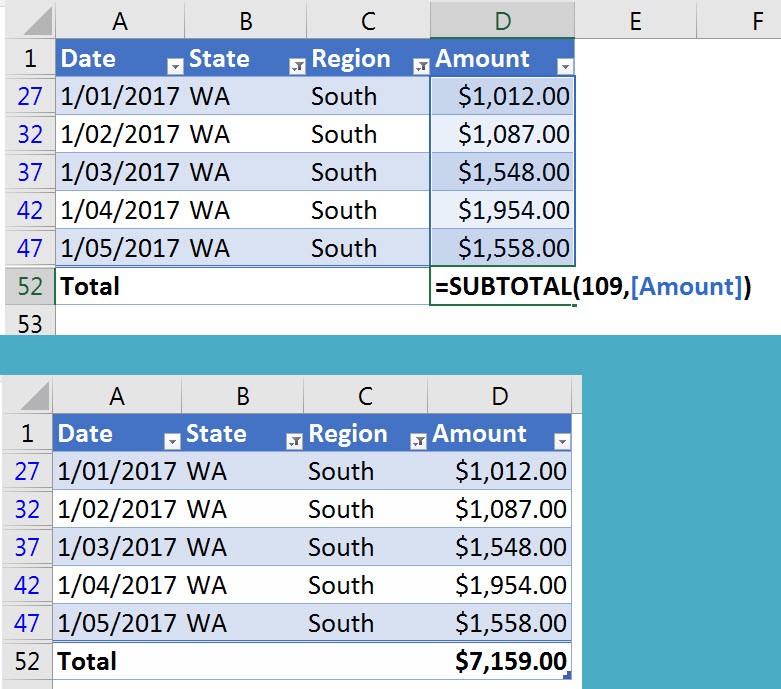
In the simple formatted table below I have filtered by State (WA) and Region (South). I have added a Total Row to the bottom of the Formatted Table (instructions at the bottom of post).
This automatically inserts a SUBTOTAL function with 109 at the bottom of the Amount column – see image below.
(If Formatted Tables are new to you – check out this post)
This is exactly how the filter context works in DAX.
It doesn’t use conditional (boolean) calculations like SUMIF or SUMIFS. It filters the table and then applies the calculations on the filtered rows ONLY. The hidden rows are ignored.
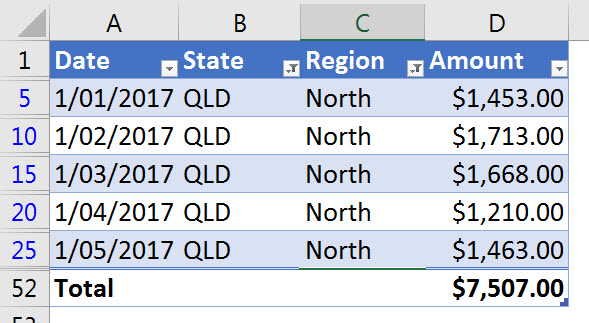
If I change the filters then the total updates.
So when considering the filter context in DAX, think of the SUBTOTAL 109 function rather than the SUMIFS function.
Filters in Power BI and PowerPivot can also be complex and trying to think it through with SUMIFS would be more difficult than SUBTOTAL with filters.
Adding a Total Row to a Formatted Table
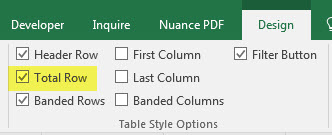
With a cell selected in a formatted table click the Design ribbon and tick the Total Row option.
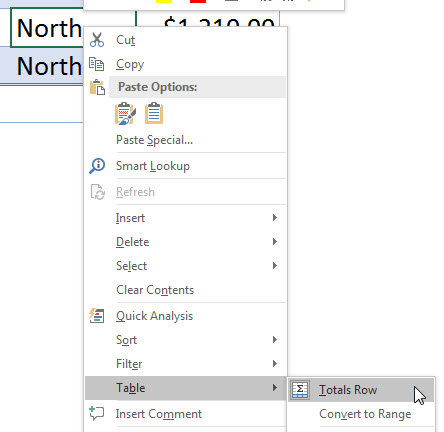
You can also right click a cell in the table and select Table and then Totals Row – see image below.
Hi Neal
Could you please recommend a good book to learn power query and power pivot?
Regards
Danni
Hi Danni
Here are some books I have and recommend – happy reading.
Power Query
First one may be out of print a new edition is on its way – best to wait for that. Weird name but a great book.
https://www.bookdepository.com/M-Is-for-Data-Monkey-Ken-Puls/9781615470341
https://www.bookdepository.com/Collect-Combine-Transform-Data-Using-Power-Query-Excel-Power-Gil-Raviv/9781509307951
Power Pivot
https://www.bookdepository.com/Power-Pivot-Power-Bi-Rob-Collie/9781615470396