The default setting for charts in Excel is to hide the data on the chart if it is hidden on the sheet. I forgot that recently when I created a few charts using a workings area to hold the chart data. I later hid the workings with column grouping. Oops – when you hide the data in the charts go blank.
To fix the issue takes six clicks for each chart. There were seven charts, so I recorded a macro and did it once and then used the macro on the other charts.
(Check out the comments section below – chart legend Jon Peltier has provided some improved macro code to help out – thanks Jon!)
I had to tweak the recorded code to get it to work on the selected chart.
When you record chart macros they tend to include the chart name. You can delete some lines of code and use ActiveChart and it should work.
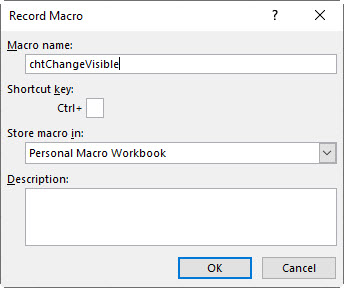
I selected the chart and recorded a macro.
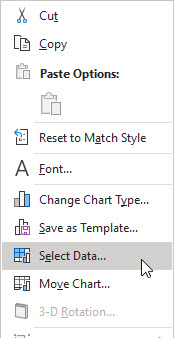
I right clicked the chart and chose Select Data.
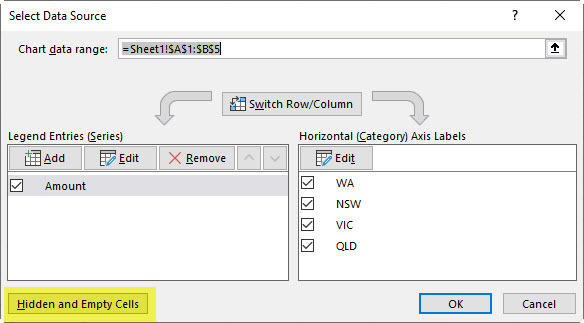
I clicked the Hidden and Empty cell button
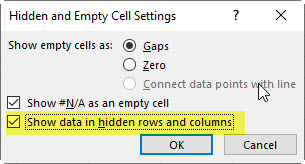
An ticked the Show Data …. check box and clicked OK and then OK again.
That’s it, done.
I stopped the macro recorder.
The recorded macro is shown below.
Sub chtChangeVisible() ' ' chtChangeVisible Macro ' ActiveSheet.ChartObjects("Chart 1").Activate Application.CutCopyMode = False ActiveChart.PlotVisibleOnly = False End Sub |
To run this on the selected chart we can remove the first two lines of code.
Sub chtChangeVisible() ' ' chtChangeVisible Macro ' ActiveChart.PlotVisibleOnly = False End Sub |
That’s the macro fixed.
You can now select a chart and run this macro to change the data visibility setting.
If you are unsure how to use macros check out this bog post.
Here are a few procedures that work together to do this work for multiple charts.
The way it works is if you have selected one chart (the active chart) is processes that chart. If you have selected some but maybe not all charts, it does the selected charts. If you have selected none, it does all charts on the active sheet.
Make your selection as described above, then run PlotAllCellsTheseCharts to plot all cells, or run PlotVisibleCellsOnlyTheseCharts to revert to the default of plotting only visible cells. Whichever one you run calls PlotVisibleTheseCharts to determine which charts to change, and PlotVisibleThisChart makes the change.
Sub PlotVisibleCellsOnlyTheseCharts()
PlotVisibleTheseCharts True
End Sub
Sub PlotAllCellsTheseCharts()
PlotVisibleTheseCharts False
End Sub
Sub PlotVisibleTheseCharts(ByRef val As Boolean)
If Not ActiveChart Is Nothing Then
‘ one chart selected
PlotVisibleThisChart ActiveChart, val
ElseIf TypeName(Selection) = “DrawingObjects” Then
‘ multiple shapes (charts?) selected
Dim shp As Shape
For Each shp In Selection.ShapeRange
If shp.HasChart Then
PlotVisibleThisChart shp.Chart, val
End If
Next
Else
‘ none selected so do all on active sheet
Dim chob As ChartObject
For Each chob In ActiveSheet.ChartObjects
PlotVisibleThisChart chob.Chart, val
Next
End If
End Sub
Sub PlotVisibleThisChart(cht As Chart, ByVal val As Boolean)
cht.PlotVisibleOnly = val
End Sub
Hi Jon
Thanks for sharing and thanks for all your content. I have followed your work for years.
Regards
Neale