Power Query
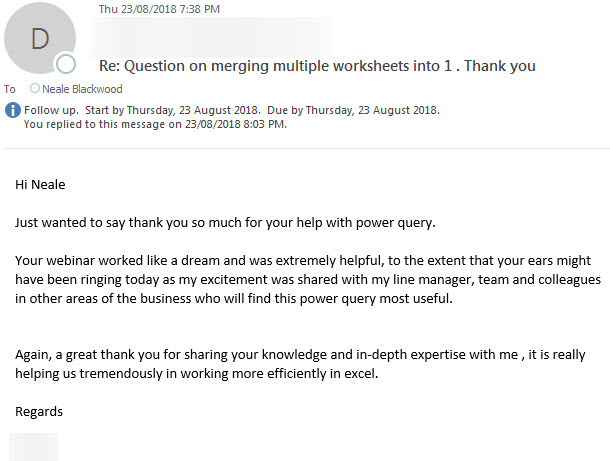
Its always great to receive e-mails like this. Power Query is a game changer.
Its always great to receive e-mails like this. Power Query is a game changer.
Power Query can easily combine data from multiple Excel files. A problem can arise if one or more of the files is open. Power Query will generate an error and the import will fail. The solution involves an old school Excel feature.
Let’s assume you have three state codes and four department codes and you want to create a table of all the possible 12 combinations (3 x 4). How do you do it so that it is flexible? i.e. if you add a new state or department it must be easy to update the combination table.
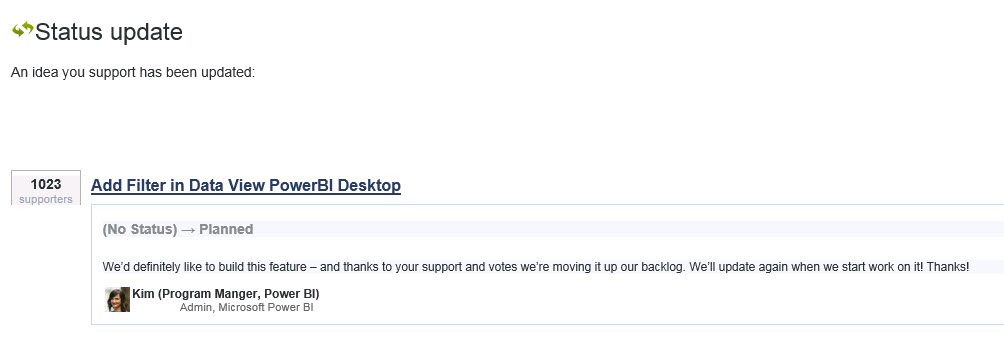
Filtering coming soon to the Data view in Power BI. Fingers crossed this gets done soon – patience everyone.
You can create complex functions with Excel to handle dates. But it makes more sense to get your data structured correctly and then you can use simpler date formulas. Power Query allows you to fix your data so that you can use those simpler formulas.
Privacy settings allow you to control who sees the Power Query data. There seems to be a bug that remembers your response to a dialog and this ignores any changes to the Privacy settings. Find out the VBA line of code that can fix it.
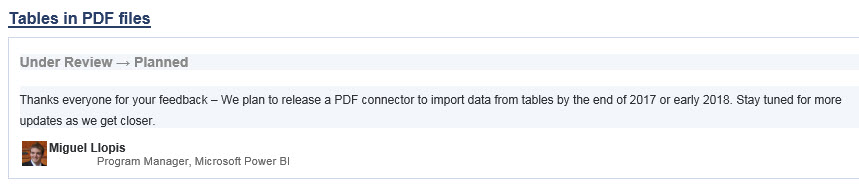
Looks like Power BI will soon be able to extract data from tables in PDF documents.
Great to see requests being acted on.
Are you trying to get your head around Filter context in DAX? I watched a video from the sqlbi.com guys and it explained it well. I thought I could add an Excel flavour to it.
There are a couple of techniques to automate a unique list of items in Excel. I have covered them in previous blog posts (see links below). I thought I would describe how to use Power Query to create a dynamic unique list.
I wonder if we can get one of these on Power BI?
Saw this on the website below and liked it – I also like Avocados.
Avocado article on the ABC site

If you are into statistics then you probably already know about the R language – but if you don’t it may be worth looking at.
It is open source code that is built to handle statistics and big data. It has some limitations when used with Power BI but it can be used on its own.
This article looks at using visuals created with R in Power BI.
DAX is the function and query language of PowerPivot and PowerBI. It has been around for a while, but it didn’t really have many editing tools until DAX Studio came around.
DAX Studio has been created by the SQLBI.com guys – the legends in PowerBI.
I saw a demo today at the Perth Modern Excel User Group at Microsoft Perth – its great.
Whilst it is a powerful editor, it is not just a code editor.
There are lots of options to allow you to optimise your DAX code. Lots of output options as well.
You can test and see how long it takes to run your DAX commands.
If you regularly use DAX in Power BI or PowerPivot then DAX Studio is a must have.
Chris Webb’s BI website is a great resource on Power BI, DAX and Power Query and Power Pivot
This post shows how to hack DAX to display characters. Opens up some new possibilities.
Compare the offerings of the Free vs Pro versions of Power BI.
The Pro version costs about AUD10 – 15 a month.
Thanks to Gilbert Quevauvilliers for creating the infographic + sharing.
A free Excel template that can
“Without any announcement, latest #powerbi desktop fixed time intelligence for non-contiguous selection of dates in #dax”
Some great tips on language usage with DAX and the M language in Power Query with examples and explanations.
You can download pdfs.
Ability to connect to the Power BI dataset and the ability to create a Query based on an example column. Interesting times ahead.
Quick measures also added.
Power Query (Get & Transform) uses the M language to allow you to customise and build in flexibility to your queries.
Currently writing the M language is tricky to write. It is case sensitive and there is no built-in help to assist you using the language.
Apparently Microsoft is working on creating an M editor, but there is no time line on when it will be ready.
This article takes you through some steps to create your own editor using Notepad ++.
If you use Power Query a lot then this may be worthwhile.
There is a new Matrix Visual report with more options. It has a separate icon so you can compare to the existing Matrix.
The new Numeric Range slicer looks interesting too.
Well after getting the data and creating a report and then a chart, let’s get the report onto the web.
Some great additions to the Power BI features this month.
More maps; dependencies view; show errors; Load More option to identify more columns in your data and converting a column into a list to name few.
A great site that has lots of free videos and other Excel content.
It covers the newer Power features of Excel plus the old standards of VBA and Dashboards.
A great site from Rob Collie and his team on PowerQuery, PowerPivot and Power BI.
Lots of free content and great ideas.
I have a few of Rob’s books and his knowledge is top shelf.
Matt Allington is an Aussie who is a Power BI expert and spreading the word on Power BI.
This is his blog, but the rest of his site has other resources as well.
His site has lots of content to help you dive into Power BI.
I have his book and am currently going through it.
Dashboard Charts are the ultimate goal of most Power BI reports, so let’s dive in.
In the previous post we extracted the data from a CSV file. Now let’s create a report. It won’t be the greatest report as the data is pretty basic, but at least its a start.
Dustin Ryan works at Microsoft and he shares a lot of his knowledge for free on his website.
This great site has lots of free content to help you get the most out of Power BI – from beginners to old hands.
Free videos and other content make this a great site to bookmark and check regularly.
It covers a lot of other topics that are related to Power BI as well.
Enjoy!
OK I have bitten the bullet and decided to get stuck in to Power BI. I am going to start playing around with Power BI Desktop – it is free after all. I thought I would blog about the experience and share my journey. I have created a Power BI category. I now have a button on my website that will list Power BI posts.
All the Power BI whitepapers in one place.