OK I have bitten the bullet and decided to get stuck in to Power BI. I am going to start playing around with Power BI Desktop – it is free after all. I thought I would blog about the experience and share my journey. I have created a Power BI category. I now have a button on my website that will list Power BI posts.The reason for the delay in my starting this journey is that Power BI is not Excel. And Excel has been my specialty for over 20 years.
All of the other Power products are Add-ins to Excel. Power BI is a standalone package that combines all the other Power products in a one stop, data shop.
But it isn’t Excel and the interface is a bit different and the other thing is Microsoft keeps updating Power BI and adding new features. This is good and bad.
It used to take two to three years to get an update out of Microsoft, now they are updating Power BI with new features almost monthly. They are even using feedback from users – this is a new Microsoft.
I have looked at Power BI before but not gone any further.
Today I have started to work with it and see what I can get it to do.
I have created a quick post here on where to download Power BI.
Data – The First Step on the Journey
You have to have data to use Power BI. The data can be in a CSV file; a database or an Excel file. Almost any type of data storage format can be used.
You can download the file I have used at the bottom of this post.
On the Home ribbon use the Get Data drop down – this gives us a list of the popular file types and there are more as well.

I used a CSV file that I used for my Power Query webinar.
Power BI has Power Query built-in, so I was able to perform all the required data cleansing on the CSV file to get the data ready to use.
If your data is ready to use you can select the file and then click Load.
In my case I need to do some data cleansing, so I clicked Edit – see image below.
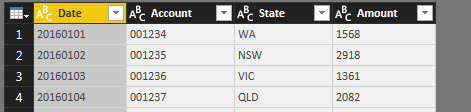
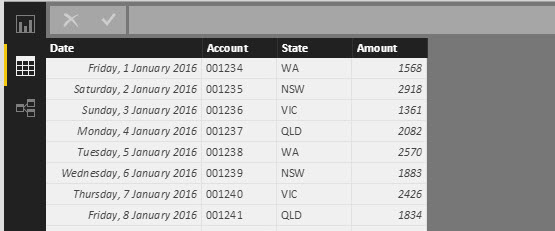
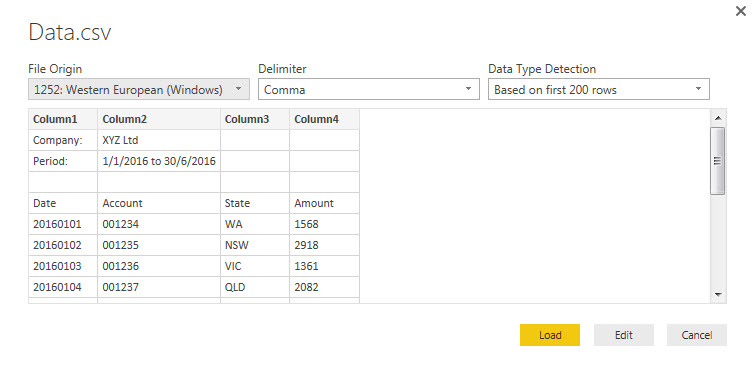 You can see the start of your data in the above dialog. As you can see I need to delete the top 3 rows and fix the Date and the Amount columns.
Edit allows me to perform these data cleansing steps.
What opens when you click Edit is pretty much the Power Query window you may have seen in Excel.
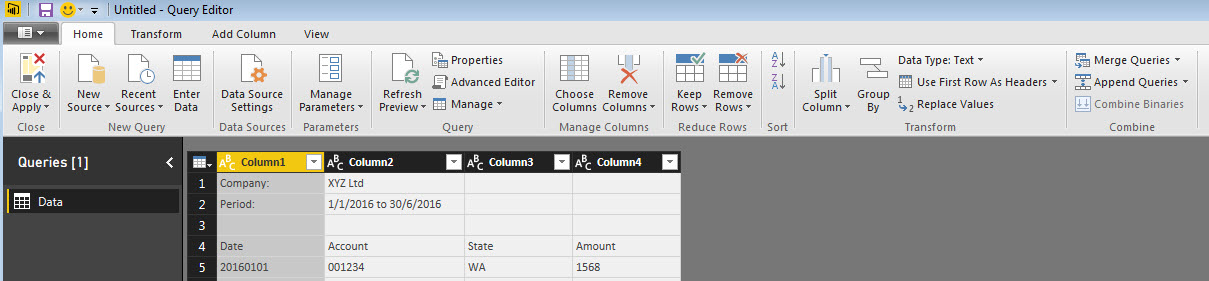
The first thing I need to do is remove the first three rows – my data starts in row 4.
This is easy – click the Remove Rows icon drop down and choose Remove Top Rows.
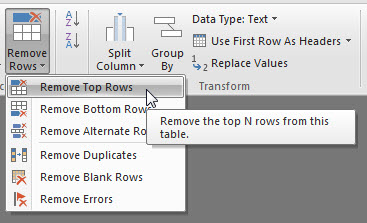
Then you type in how many rows to remove – 3 in my case and click OK.
 The data changes as below.
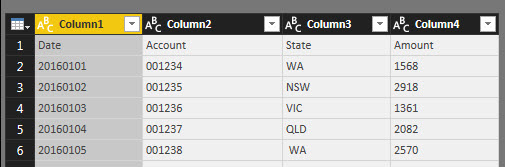
Next we can use row 1 as our field (column) headers. Guess what – there is a button for that process on the Home Ribbon.
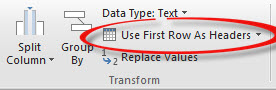
Magic – see below.
Note: the little symbols on the left of the field names. This specifies what type of data is in the field. All of them are ABC which means they are all text. Not what we want.
In our case the Date and Amount columns need to changed to match their respective content. Simply click on the little ABC symbol and select the type of Data you want. Date and Decimal Number in our case.
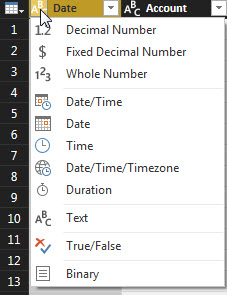 Now the data is ready to use. Note the little icons on the left have changed in the headings.
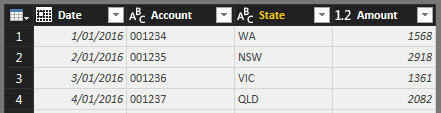
On the right of the screen the Query Editor has kept a listing of all the steps you have taken.
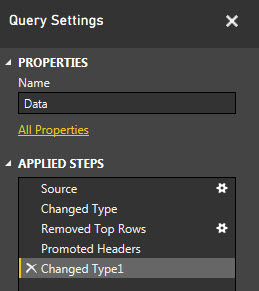 If you are into macros, this is very like the macro recorder in Excel.
The steps can be amended if there is a cog symbol on the right of the step – eg Source and Remove Top Rows have that symbol.
Now it’s time to mention an important limitation of Power BI.
YOU CAN’T UNDO!
OK pick yourself up off the floor. Yes, you’ve been undoing things your whole computer life, but not in these Power products.
You can use the x symbol on the left of the step to delete the step or the cog symbol on the right of the step to amend. But you can’t undo a step as such.
By deleting a step you are in effect undoing it, but there is no undo button or command. When you undo the step you revert the data back to what it was before the step was performed – sort of an undo.
Just accept the limitation and move on and work with it.
These built-in processes are so simple and quick that having to redo a step is a piece of cake. Also you need the practice when you are starting out anyway.
Close & Apply
Now that the data is ready, click the Close and Apply icon and you are presented with the Power BI window. We have a Home ribbon tab and Modelling tab.
There are three small icons in the top left of screen. These control the display.

The top one is the standard view – ready for creating a dashboard.
The second icon is the data view – more like Excel.
The third icon is the Relationships view – it is used when there are relationship between tables.
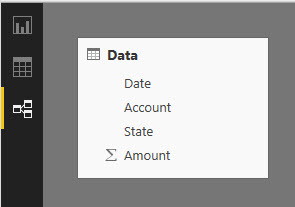 We don’t have any relationships so it just shows the field (column) names.
Yes, you can bring in multiple tables, even from different sources and relate them together in Power BI – this is an awesome super power.
My next post will be about creating a simple dashboard.
I have included the CSV data file below that I used above, if you want to play along.
The next post will be on creating a report with the data we have just imported.
Please note: I reserve the right to delete comments that are offensive or off-topic.